The chart shows the percentage of tourists to Scotland who visited four different types of attractions from 1980 to 2010.

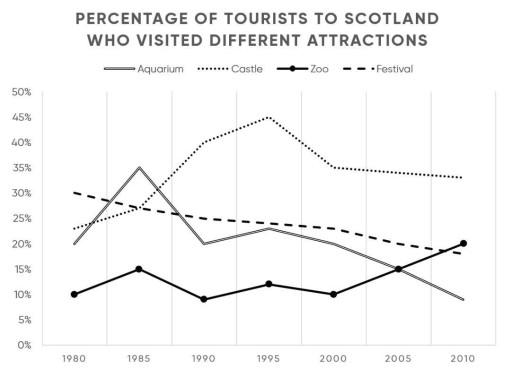
The line graph gives information about the proportion of tourists
Scotland visited different
attractions
the namely aquarium
zoo
castle
and festival between 1980 and 2010
Overall
the proportion of castlesCastle showed rising trends whereas
that of aquariums was small with castles having the biggest .
According to
the line graph that showed aquarium
significant rising 20%percentage
of different attractions
in 1980. Castle
slightly 23 % proportion of attractions
in 1980. Zoo
marked 9 %percentage of different attractions
in 1980. Festival high rising 31 %proportion of attractions
in 1980. Aquarium
the rising 34%percentage
of attractions
in 1985. Castle
minimal 34 percentage
of different Replace the word
per cent
attractions
in 1985. Zoo
a little bit 15 %percentage of different attractions
in 1985. Festival fell 33 %proportion of attractions
in 1985. The aquarium
suddenly dropped the 20
Correct your spelling
20 proportion
%proportion
of different attractions
in 1990. The Castle
dramatically had 40 %percentage of different attractions
in 1990. Zoo
minimal drop 10 %percentage of attractions
in 1990. Festival gradual 22 %proportion of different attractions
in 1990. Aquarium
rose 23 %percentage of Fix the agreement mistake
Aquariums
attractions
in 1995 . Castle
a little rising 45%percentage
of attractions
in 1995 . Zoo
11 minimal %percentage of different attractions
in 1995. Festival didn't change 23%proportion
of attractions
in 1995 . Aquarium
saw Fix the agreement mistake
Aquariums
declined
of 22 %proportion of Change the form of the verb
decline
attractions
in 2000. Castle
fell 35%percentage
of different attractions
in 2000. Zoo
average 10%proportion
of different attractions
in 2000. Festival decreased by 25 %percentage of attractions
in 2000 Aquarium
dropped by 18 %proportion of attractions
in 2005. Castle
declined 35 %percentage of different attractions
in 2005 Zoo
significant 18 % percentage of attractions
in 2005. Festival decrease 15 %proportion of attractions
in 2005Submitted by hamzayevasamina on
Unauthorized use and/or duplication of this material without express and written permission from this site’s author and/or owner is strictly prohibited. Excerpts and links may be used, provided that full and clear credit is given to Writing9 with appropriate and specific direction to the original content.
Sentences: Add more complex sentences.
▼
Common mistake: Your writing should be 150-250 words.
Basic structure: Change the second paragraph.
▼
Vocabulary: Replace the words attractions, aquarium, zoo, castle, %percentage, %proportion with synonyms.
▼
Vocabulary: The word "graph" was used 2 times.
▼
Vocabulary: The word "showed" was used 2 times.
▼
Vocabulary: The word "percentage" was used 10 times.
▼
Vocabulary: The word "proportion" was used 9 times.
▼
Vocabulary: The word "declined" was used 2 times.
▼
Vocabulary: The word "decreased" was used 2 times.
▼
Vocabulary: The word "fell" was used 2 times.
▼
Vocabulary: The word "significant" was used 2 times.
▼
Vocabulary: Use several vocabularies to present the data in the second paragraph.
▼