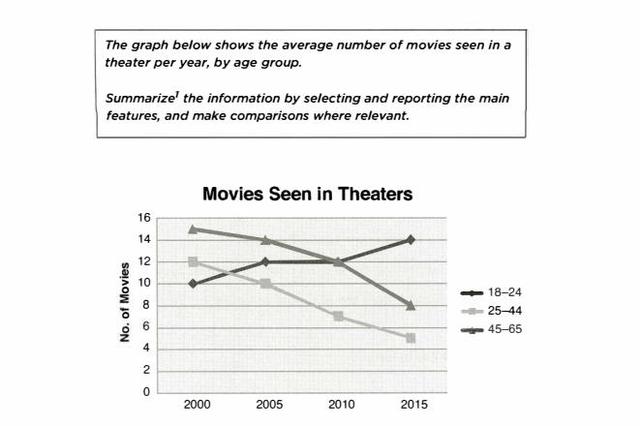
The given chart below illustrates the proportion of individuals of 4 kinds age groups who watched in movie theater in one national European between 2000 and 2011.

This
graph depicts 4 kinds age groups
who watched in movie
Add an article
a movie
the movie
theater
in one national European, by the y-axis Change the spelling
theatre
it
shows the percentages of the 4 kinds age and the x-axis illustrate the change in Correct pronoun usage
apply
years
.
By observing the graph it seems that the 15-24 group
was facing many changes during the years
, and the group
7-14, 25
-35 seems more staple and closer to each other, they started with a different percentage and ended up with the same percentage, the Correct word choice
and 25
group
who include 35 and over did not face any noticable
changes compared to the other Correct your spelling
noticeable
notable
groups
but only in the last
3 years
the group
started to face unsual
changes.
Correct your spelling
unusual
To conclude
, all of the three groups
was having
an extreme amount of Wrong verb form
had
changing
in the percentage Replace the word
change
expect
the 35 and over Correct your spelling
except
group
, it was more stable than the other Add an article
the group
groups
but only in the last
3 years
the Add a comma
years,
percenrage
Correct your spelling
percentage
started
to increase.Replace the word
start
Submitted by ahmed2024oudah on
Unauthorized use and/or duplication of this material without express and written permission from this site’s author and/or owner is strictly prohibited. Excerpts and links may be used, provided that full and clear credit is given to Writing9 with appropriate and specific direction to the original content.
Sentences: Add more complex sentences.
▼
Linking words: Don't use the same linking words: "last".
▼
Vocabulary: Replace the words groups, years, group with synonyms.
▼
Vocabulary: The word "graph" was used 2 times.
▼
Vocabulary: The word "change" was used 4 times.
▼
Vocabulary: The word "percentages" was used 4 times.
▼