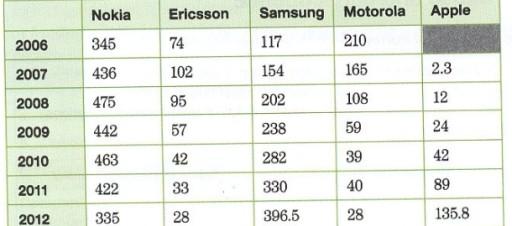
The table shows the number of mobile phones sold in millions for a period of six years. Summarize the information by selecting and reporting the main features, and makecomparisons where relevant.

Contained in the illustration is information pertaining to mobile phone
sales
by five technology organizations between 2006 and 2012.
From an observational perspective, it can be seen that Samsung and Apple witnessed upward trends while
Nokia
, Ericsson and Motorola experienced downward trends. Additionally
, Nokia
dominated the market for the majority of time
.
Looking at the chart in Add an article
the time
further
detail, Samsung stood at 117 million
sales
in 2006 before increasing rapidly to 320 million
in 2011. In 2012, Samsung knocked down the Nokia
monopoly with 396.5 million
sales
. Similarly
, Apple began in 2007 with only 2.3 million
sales
which was the lowest sales
of all but climbed continuously to 135.8 million
unit sales
in 2012.
Turning to the remaining companies, Nokia
sold the most mobile phones of all with 345 units in 2006 and saw a fluctuation between
in the next 4 years. Change preposition
apply
However
, it managed to get the sales
to 422 million
but dropped by almost 100 million
sales
in 2012. The same pattern can be observed in Ericsson and Motorola, they started at 74 million
and 210 million
sales
respectively. During the following 6 years, both manufacturers' Change preposition
in sales
sales
decreased dramatically to the same point at 28 million
sales
.Submitted by goodnight on
Unauthorized use and/or duplication of this material without express and written permission from this site’s author and/or owner is strictly prohibited. Excerpts and links may be used, provided that full and clear credit is given to Writing9 with appropriate and specific direction to the original content.
Introduction: The introduction is missing.
▼
Introduction: Change the first sentence in the introduction.
▼
Introduction: The chart intro is missing.
▼
Introduction: The chart intro is missing.
▼
Vocabulary: Replace the words sales, nokia, million with synonyms.
▼
Vocabulary: The word "trends" was used 2 times.
▼