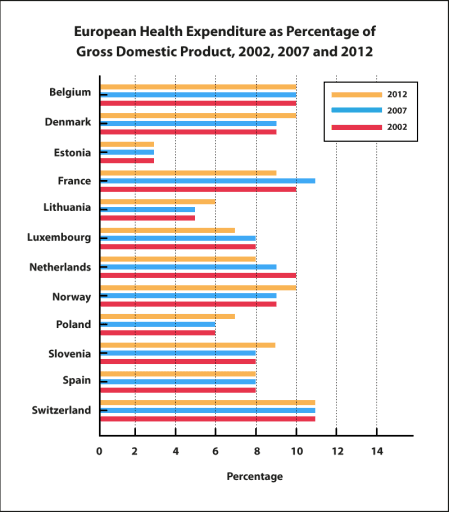
The bar chart below shows current health expenditure totals as percentages of GDP* for various European countries for the years 2002, 2007 and 2012. Summarise the information by selecting and reporting the main features, and make comparisons where relevant. You should write at least 150 words. * GDP (Gross Domestic Product) is the total value of goods that are made and services that are provided in a country.

#bar #health #expenditure #percentages #gdp* #european #countries #years #summarise #information #features #comparisons #gdp #product #value #goods #services #country
The
bar
chart
illustrates the existing health
expenses as a percentage of Gross
Domestic Product (Correct article usage
the Gross
GDP
) of several European nations
for three different years 2002, 2007 and 2012.
In the bar
chart
, there are 12 European countries
against which health
expenditures are provided as percentages of GDP
for three consecutive time periods that are 2002, 2007 and 2012. Some European countries
have the same amount of spending on health
in all three years while
in some nations
, health
expenditure are
increased or decreased from 2002 to 2012 as percentages of Unnecessary verb
apply
GDP
.
The bar
chart
reflects that Belgium, Estonia, Spain and Switzerland are the countries
which have constant health
expenditures as percentage
of Add an article
a percentage
GDP
throughout the time period with 10%, 3%, 8% and 11%.
Furthermore
, the bar
chart
also
depicts that there are some nations
against which health
expenses fluctuate in the year
2002, 2007 and 2012. Denmark, Lithuania, Norway, Poland and Slovenia are the Fix the agreement mistake
years
countries
in which health
expenditures as percentage
of Add an article
a percentage
GDP
are more in the year 2012 in comparison with the years 2007 and 2002 while
other nations
such
as France, Luxembourge
and Netherlands have Correct your spelling
Luxembourg
less
Change the quantifier
fewer
health
expenses as percentages of GDP
in the year 2012 in relation to 2007 and 2002Submitted by nida.naeem64 on
Unauthorized use and/or duplication of this material without express and written permission from this site’s author and/or owner is strictly prohibited. Excerpts and links may be used, provided that full and clear credit is given to Writing9 with appropriate and specific direction to the original content.
Linking words: Don't use the same linking words: "while".
▼
Vocabulary: Replace the words bar, chart, health, gdp, nations, countries with synonyms.
▼
Vocabulary: The word "chart" was used 4 times.
▼
Vocabulary: The word "percentage" was used 6 times.
▼