The three pie charts below show the changes in annual spending by a particular UK school in 1981, 1991 and 2001. Summarise the information by selecting and reporting the main features, and make comparisons where relevant.

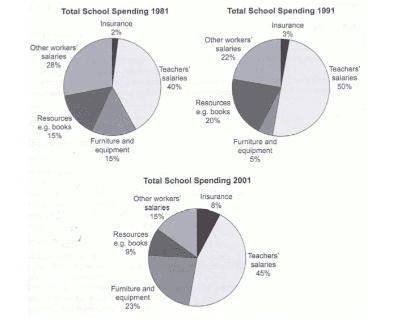
The three pie charts illustrate the annual expenditure of UK schools in three different years: 1981, 1991, and 2001.
Overall
, a significant percentage of the budget was spent on staffs’
salaries, Fix the agreement mistake
staff’
while
insurance expenses accounted for the smallest among the five categories.
In 1981, the largest portion of expenditure was allocated to wages for teaching staff, amounting to 40% of the total. This
percentage increased by a quarter in 1991, reaching a peak before experiencing a slight decline to 45% in 2001. In comparison, in 1981, salaries of non-academic employees constituted 28% of the overall
expenses. However
, their share gradually decreased throughout the 20-year period, finishing at 15% in 2001.
Insurance expenses initially
made up only 2%, representing the least proportion. Subsequently
, it remained stable during the first 10 years, then
reaching its peak at 10% in 2001. The share of furniture and equipment commenced equally to that of educational resources, both
accounting for 15%. Correct pronoun usage
apply
While
the former dropped by two-thirds before rising almost fivefold to 23%, the latter witnessed a minimal rise before falling to just below 10 in 2001.Submitted by nnatthinee on
Unauthorized use and/or duplication of this material without express and written permission from this site’s author and/or owner is strictly prohibited. Excerpts and links may be used, provided that full and clear credit is given to Writing9 with appropriate and specific direction to the original content.
Linking words: Don't use the same linking words: "overall, while".
▼
Vocabulary: The word "percentage" was used 2 times.
▼