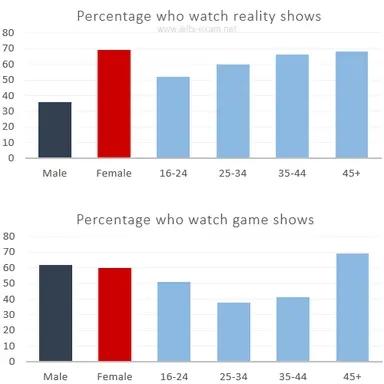
The charts give information about two genres of TV programmes watched by men and women and four different age groups in Australia.

While
the first bar chart illustrates the growth of the population in England and Wales for three centuries beginning from 1700, the second block delineates the details regarding births and deaths for the same period. Then
units are given in millions for the first demonstrative table such
as childbirths and people's dying are shown per 1000.
Looking from an overall
perspective it is readily apparent that the number of people rose dramatically over the period when death and birth rates reduced following the peak in 1800 and the demographics show a similar trend for the set course when mortality was lower than delivery at any demonstrating period.
Furthermore
, in terms of statistics, in 1700 it was around 10 million and arrived at the top of just under 40 million in 1900 before hitting a high of almost 50.000,000 in the next one hundred years.
With regards to birth and death sums, they followed a more or less similar pattern. Although
, both started at a low level in 1700 ( birth - just below 10 and deaths exactly above 5) plunged to a level of more than 20 per 1000 and above 15 per 1000 in 1800 before dropping to about 10 and above 5 respectively during 1900. Moreover
, in 2000 both figures declined further
to reach the lowest level for thirty years, comprising nearly 10 births and exactly 5 deaths.Submitted by lioness1970 on
Unauthorized use and/or duplication of this material without express and written permission from this site’s author and/or owner is strictly prohibited. Excerpts and links may be used, provided that full and clear credit is given to Writing9 with appropriate and specific direction to the original content.