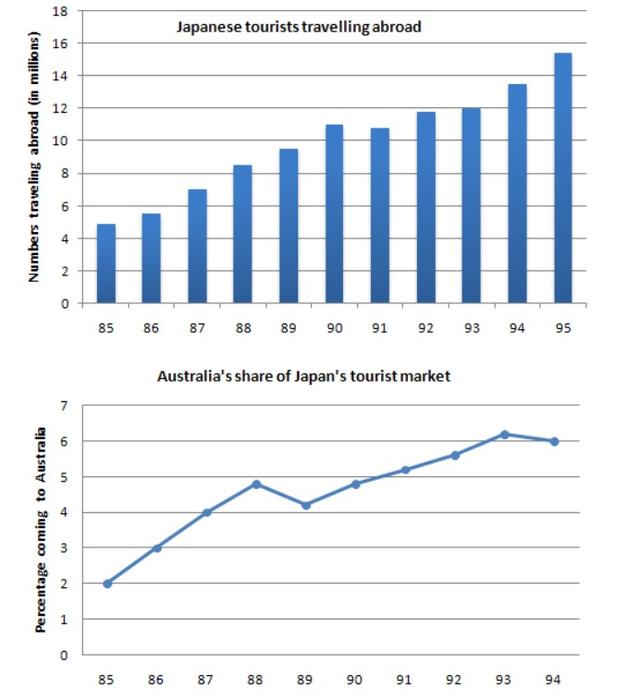
The bar chart gives information about the number of overseas Japanese tourists between 1985 and 1995, and the line graph illustrates percentage of those going to Australia between 1984 and 1994.

The bar chart illustrates the statistics regarding the
number
of Japanese
people
who traveled
outside of the country, Change the spelling
travelled
while
the line graph depicts the information on the percentage of Japanese
tourists visiting Australia in a 10-year period, starting in 1985. Overall
, it can be seen that both experienced an upward trend throughout.
Regarding the bar chart, in 1985, the number
of Japanese
tourists traveling
abroad Change the spelling
travelling
initially
commenced at the lowest number
, at roughly 5 million people
. After that, it increased sharply for the next five years, reaching nearly 11 million people
in 1990. There was a small fluctuation between 1991 and 1993. Then
the number
witnessed a
significant growth, finishing at its peak, with approximately 15 million Remove the article
apply
people
at the end
of the period.
Moving on to the line graph, the percentage of Japanese
individuals visiting Australia began with 2%. It rose gradually to 5% in 1989. However
, the number
increased and decreased in the next two years. While
it continued to grow minimally, peaking at just over 6% in 1994, it saw a small decrease to exactly 6% in 1995.Submitted by nnatthinee on
Unauthorized use and/or duplication of this material without express and written permission from this site’s author and/or owner is strictly prohibited. Excerpts and links may be used, provided that full and clear credit is given to Writing9 with appropriate and specific direction to the original content.
Linking words: Don't use the same linking words: "while".
▼
Vocabulary: Replace the words number, japanese, people with synonyms.
▼
Vocabulary: The word "chart" was used 2 times.
▼
Vocabulary: The word "graph" was used 2 times.
▼
Vocabulary: The word "number of" was used 2 times.
▼
Vocabulary: The word "percentage" was used 2 times.
▼
Vocabulary: The word "decreased" was used 2 times.
▼
Vocabulary: The word "increased" was used 2 times.
▼