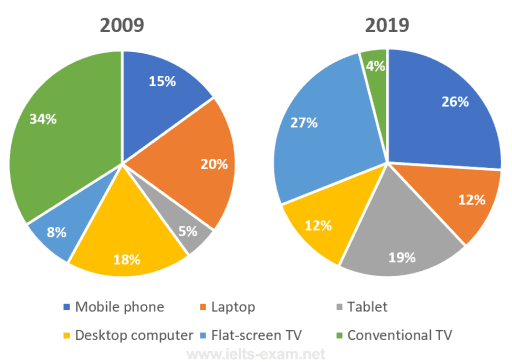
The pie charts below show the devices people in the 18 to 25 age group use to watch television in Canada in different years

The pie chart displays the technological gadgets which
people
used the watch television
age of between 18 and 25 in Canada in 2009 and 2019.
Firstly
, in 2009 most people
used to watch television
from their conventional televisions, followed by laptops which had 20 per cent
but desktop computer ratio was lower than laptops and its rate was 18 per cent
. People
who watched television
from mobile phones were in the fourth line followed by flat-screen TV
and only a small group of individuals who watched television
from tablets ratio was 5 per cent
.
Secondly
, watching television
from conventional TV
had decreased to 4 per cent
, it is in the bottom line and its place was replaced by a flat-screen TV
, which is 27 per cent
followed by mobile phones, their ratios were nearly the same. The tablet rate had increased by 14 per cent
and it was in third place and for people
who watched television
from a laptop and desktop computer rates were 12 per cent
.
To sum up
, in ten years individuals watching television
habits changed drastically , especially with tablets, conventional TV
and flat-screen TV
.Submitted by atakantemizkan0 on
Unauthorized use and/or duplication of this material without express and written permission from this site’s author and/or owner is strictly prohibited. Excerpts and links may be used, provided that full and clear credit is given to Writing9 with appropriate and specific direction to the original content.
Vocabulary: Replace the words people, television, cent, tv with synonyms.
▼
Vocabulary: Rephrase the word "undefined" in your introduction.
▼
Vocabulary: The word "ratio" was used 3 times.
▼