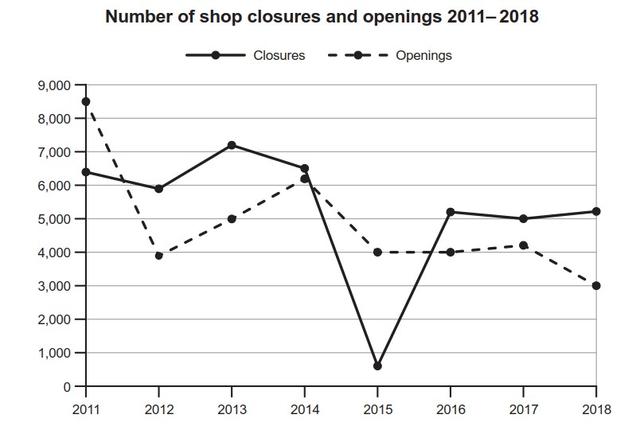
The chart shows the number of shops that closed and the number of new shops opening in a country from 2011 to 2018.

The line graph illustrates
a
number of opened and closed shops in one nation between 2011 and 2018.Shops are measured in thousands .
Looking from the Correct article usage
the
overall
perspective,more shops are shut down in a given period compared to new shop openings.
Getting into detail analysis , starting in 2011 there were abovethan
Correct your spelling
above than
6stores
closed, and fell to just below 6 in the following Correct your spelling
6 stores
year
2012 , and stood over 7 in the following year
. drastically declined to below 1 in the year
2015 . It suddenly increased to just above 5 in 2016 and then
slightly decreased to 5 in 2017 and rebounded back to the 2016 number .
However
, on the other side , openings began at around 8.5 in the year
2011 , down almost double to just under 4 in 2012 ,then
rose to over 6 in 2014 and declined to 4 in 2015 , remaining unchanged the next year
,slightly rising before it settled down exactly on 3 in the year
2018Submitted by nikhilguni on
Unauthorized use and/or duplication of this material without express and written permission from this site’s author and/or owner is strictly prohibited. Excerpts and links may be used, provided that full and clear credit is given to Writing9 with appropriate and specific direction to the original content.
Vocabulary: Replace the words year with synonyms.
▼
Vocabulary: Rephrase the word "number of" in your introduction.
▼
Vocabulary: The word "declined" was used 2 times.
▼
Vocabulary: The word "slightly" was used 2 times.
▼