The chart below shows the average money spent per costumer on various types of equipment in a Canadian sports store

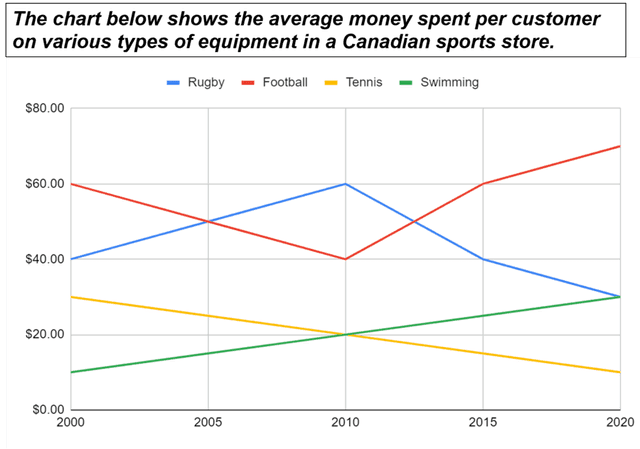
The line chart indicates the average money spent by each customer on equipment for various sports in a sports shop in Canada between 2000 and 2020.
Overall
, it is clear that
purchasing payment for the equipment for rugby and football had relatively more changes than for tennis and swimming during the 20-year period.
Looking at the graph more closely, one can see that customers spent the most bill on Football equipment at $60 in 2000, but it plummeted rapidly to $40 by 2010. Meanwhile, consumption of Rugby was $40, the second highest amount in question, however
, surged suddenly to $60 in 2010, even if it went down again after the year. The growth of used money was slow for swimming and the same as for rugby about $30 in 2020. Finally
, the pay for which tennis tools were bought had decreased gradually and hit a low of the total at $10.Submitted by a46615883 on
Unauthorized use and/or duplication of this material without express and written permission from this site’s author and/or owner is strictly prohibited. Excerpts and links may be used, provided that full and clear credit is given to Writing9 with appropriate and specific direction to the original content.
Conclusion: The conclusion is too long.
Vocabulary: Rephrase the word "undefined" in your introduction.
▼