The given table illustrates the proportions of attendance in secondary schools in India. These values are given from 2000 to 2015 with a gap of 5 years.

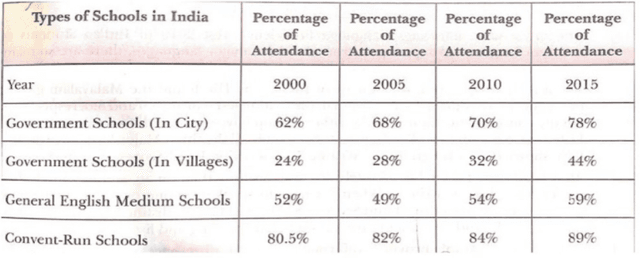
The table compares the percentage of students that attended different types of
schools
in India every 5 years, from 2000 to 2015.
Overall
, attendance
was the highest among convent-run schools
and the lowest among village government schools
. Furthermore
, all schools
saw a rise in the proportion of attendees over the entire period.
In 2000, government-run city schools
had an attendance
rate of 62%, compared to village government schools
, where only 24% of students attended classes. Nevertheless
, each school witnessed a drastic rise in the proportion of attendees in the following years and by 2015, 78% of students were attending the government city schools
and 44% attended the schools
in villages.
On the other hand
, attendance
rates fluctuated slightly in General English medium schools
, dropping from 52% in 2000 to 49% in 2005, after which it showed a rise ending at 59% in 2015. In Contrast
, the Covent-run schools
which were the most attended, started the period with an 80.5% attendance
rate and ended it with 89% in 2015.Submitted by chanchaldubai1 on
Unauthorized use and/or duplication of this material without express and written permission from this site’s author and/or owner is strictly prohibited. Excerpts and links may be used, provided that full and clear credit is given to Writing9 with appropriate and specific direction to the original content.
Sentences: Add more complex sentences.
▼
Conclusion: The conclusion is too long.
Vocabulary: Replace the words schools, attendance with synonyms.
▼
Vocabulary: The word "compares" was used 2 times.
▼
Vocabulary: The word "proportion" was used 2 times.
▼
Vocabulary: The word "rise" was used 3 times.
▼

