The two pie charts provide information about boys and girls’ participation rates in various activities after the survey.

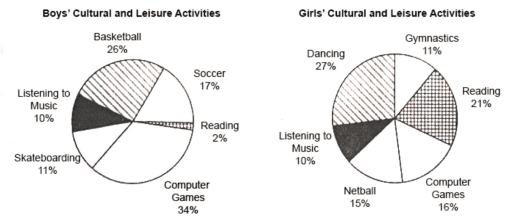
The presented pie charts depict the differences between
boys
' and girls
' cultural and leisure activities. Overall
, it can be observed that there is a huge difference between both of these genders when it comes to playing computer games and reading. Girls
prefer to read books than playing
computer games Wrong verb form
play
whereas
, boys
are opposite
when it comes to Correct article usage
the opposite
this
trend.
To begin
with, both have the same taste when it comes to listening to music. However
, the difference is of
more than 19 Change preposition
apply
percent
when it comes to reading as Change the spelling
per cent
girls
go with reading 21 percent
but for Change the spelling
per cent
boys
the percentage is only 2 Add a comma
boys,
percent
. The difference in Change the spelling
per cent
percetile
is more than half when comes to playing online games as Correct your spelling
percentage
boys
prefer it more than girls
.
On the other hand
, there are few
different activities that Correct article usage
a few
boys
participate in but girls
not
and these are skateboarding, playing soccer and basketball. Add a missing verb
do not
On the contrary
, girls
indulge themselves in dancing, playing netball and doing gymnastics.Submitted by kiran.deep24 on
Unauthorized use and/or duplication of this material without express and written permission from this site’s author and/or owner is strictly prohibited. Excerpts and links may be used, provided that full and clear credit is given to Writing9 with appropriate and specific direction to the original content.
Basic structure: Change the third paragraph.
▼
Vocabulary: Replace the words boys, girls with synonyms.
▼
Vocabulary: Only 6 basic words for charts were used.
▼
Vocabulary: The word "differences" was used 4 times.
▼
Vocabulary: Use several vocabularies to present the data in the third paragraph.
▼