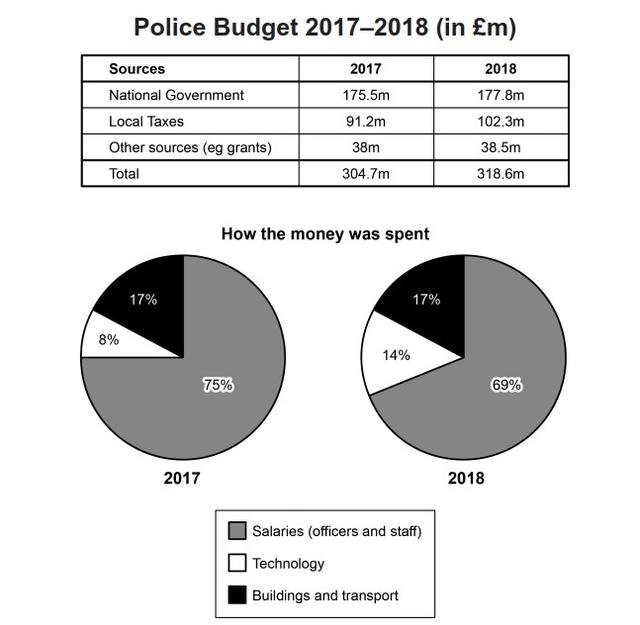
The table and charts below give information on the police budget for 2017 and 2018 in one are of Britian. The table shows where the money came from and the charts show how it was distribiuted.

The figures illustrate the financial allocation of the British Police between 2017 and 2018. The table shows the list of income,
whereas
the pie chart compares the expenditure.
Overall
, the total income increased from 2017 to 2018. The biggest source for the police in both years was from the national government. Then
, they allocated a huge expense on the officer's and staff's salaries.
To begin
with, there was around a 14.1 million
increment in the total income within the period. The all-time highest source was from the national government with a 2.3 million
increment but the Local Taxes had the biggest surge at 10.1 million
. Other than that, other sources such
as grants only add up to about 0.5 million
.
Next,
the police utilized the majority of the budget for their staff's salaries, however
, the percentage decreased from 75% to 69% in 2018. Besides
, they also
paid for technology tools to support the office's operation with a constant ratio of 17%. Lastly
, the fraction for buildings and transport went up from 8% to 14% at the end
of the period.Submitted by evaagustine11 on
Unauthorized use and/or duplication of this material without express and written permission from this site’s author and/or owner is strictly prohibited. Excerpts and links may be used, provided that full and clear credit is given to Writing9 with appropriate and specific direction to the original content.
Sentences: Add more complex sentences.
▼
Conclusion: The conclusion is too long.
Vocabulary: Replace the words million with synonyms.
▼

