You should spend about 20 minutes on this task. The line graph shows the information average number of visitors entering a museum in summer and winter in 2003. Write a report for a university lecturer describing the information shown below. You should write at least 150 words.

The line chart below displays the data of the average number of people who visited a museum during both summer and winter in 2003
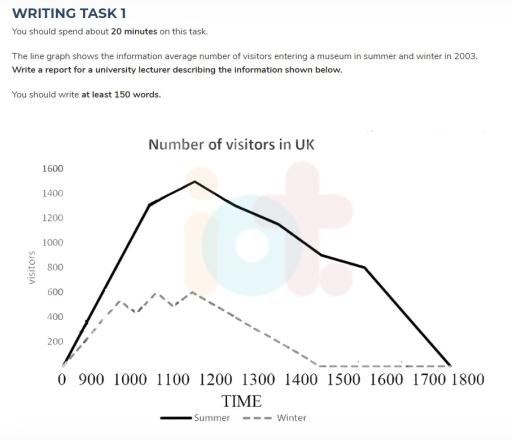
Overall
, there is the statistic of visitors in the UK in the line graph. The X represents the period, and the Y shows the number of visitors. As a result
, there are two categories, the first feature represents the whole viewers of the museum at a certain time in hot seasons, while
, the second part illustrates the quantity of villagers at different times in cold months.
There are a lot of visitors exactly 1400, who prefer to go to the facility at 11:30 am compared to another time in summer. Meanwhile, there are less of humans at 15:00 pm, only 800.
In other hand, there are fewer viewers in winter comparing for those during vacations. There are only 600 citizens who were in the museum at 11:30, which is the half of people who did sightseeing in summertime. In both cases the number decreased in the evening.Submitted by akzharkynzhamal on
Unauthorized use and/or duplication of this material without express and written permission from this site’s author and/or owner is strictly prohibited. Excerpts and links may be used, provided that full and clear credit is given to Writing9 with appropriate and specific direction to the original content.
Vocabulary: The word "represents" was used 2 times.
▼
Vocabulary: The word "number of" was used 2 times.
▼