The chart below shows the changes in sales of four different types of books from 2002 to 2012. summarise the information by selecting and reporting the main features, and make comparisions where relevant.

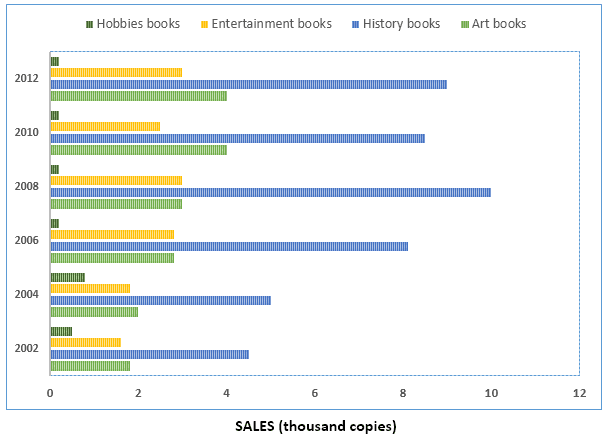
The given bar chart illustrates the distribution of books sold across four different text categories in terms of thousand unit replica profitable between 2002 and 2012.
Overall
, the proportion of history ones was the most significant album wholesales while
the balance of hobbies reports was at least. However
, entertainment records and art magazines were similarly
grown up in every year. According to
the graph, history stories were the leader in book monetaries every two different years. It dramatically rose from 4 to 10 unit selling from 2002 to 2008, respectively, Even though, the rates of unit profit-making dropped but it still rose in the years 2012. In addition
, the number of art booklets, which were sold, gradually rose every year from 2 copies to 4 image sales.
On the other hand
, the sum of hobby book buys by customers slightly increased from almost 1 thousand copies sales to approximately 2 from 2002 to 2006. Before, it was equally represented the same ratio to the year 2012. Entertainment books relatively increased from 2002 to 2012 more than 1 thousand copies sales.Submitted by lioness1970 on
Unauthorized use and/or duplication of this material without express and written permission from this site’s author and/or owner is strictly prohibited. Excerpts and links may be used, provided that full and clear credit is given to Writing9 with appropriate and specific direction to the original content.
Vocabulary: The word "increased" was used 2 times.
▼