The line graph below shows the number of serious crimes that occurred in London between 2003 and 2012. Summarise the information by selecting and reporting the main features, and make comparisons where relevant.

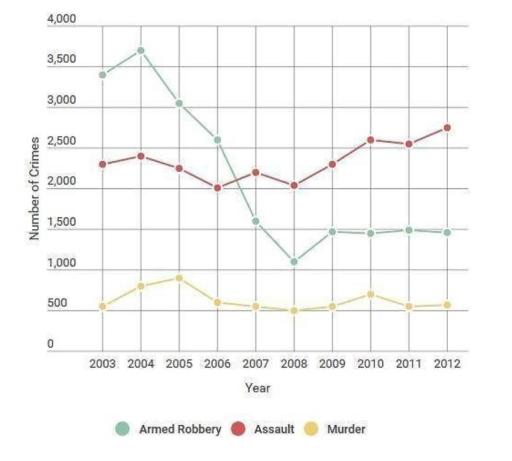
The multiple-line chart illustrates the trend of the three most dangerous crimes,
such
as armed robbery, assault
, and murder in London over 9 years, between 2003 and 2012.
Overall
, the armed robbery incident dramatically dropped and went stagnant in the last
five years. On the contrary
, assault
fluctuated and tended to increase in the latest year. Similarly
, murder was also
slightly fluctuating, but it was more constant than assault
in recent periods.
To begin
with, armed robbery was the highest number of crimes in London for the first four years. However
, it fell significantly from approximately 3700 in 2004 to roughly 1000 in 2008. Then
, it grew steeply in 2009 to 1500 cases and the record stuck for the rest of the period.
Assault
and murder graphs showed ups and downs within the period. The assault
started in about 2300 and declined to 2000 in 2006, but it rocketed to almost 3000 occurrences in 2012, becoming the most common illegal act in London. The murders were the same, besides
it only floated up between 2003 and 2005 to nearly 1000 records, after that, it stayed at more than 500 until the end of the period.Submitted by evaagustine11 on
Unauthorized use and/or duplication of this material without express and written permission from this site’s author and/or owner is strictly prohibited. Excerpts and links may be used, provided that full and clear credit is given to Writing9 with appropriate and specific direction to the original content.
Sentences: Add more complex sentences.
▼
Vocabulary: Replace the words assault with synonyms.
▼